I have been trying to find a place to host the Excel files so I can make them available for download.
Sometimes just a blog with pictures and descriptions isnt enough.
Click the link below to download a spreadsheet with the Count Color macro from my previous Post
File Test (Count-Color - Excel Macro)
This hosting is from Google Sites.
Wednesday, December 12, 2012

Thursday, October 25, 2012
Report view and data view Macro
This macro is for when you have a large spreadsheet that you maintain and update.
Usually there is a lot of data hidden when you present this as a report.
To complete your work you unhide everything, and make your edits, then go through the tedious process of hiding the data that doesnt need to be seen.
My solution is to have a pulldown in cell A1 to choose between Report view and Data view.
Start by adding a pulldown in A1.
Select A1, then click the data tab and choose data validation.
In the settings Tab, choose List, check the two boxes, and type in Data,Report in the source Input.

Now were ready to insert the code.
Right click the sheet dab and click view code.

Now paste the following into the text area.
Private Sub Worksheet_Change(ByVal Target As Range)
If Range("A1").Value = "Data" Then
Range("B:C,E:H,K:N").EntireColumn.Hidden = False
End If
If Range("A1").Value = "Data" Then
Range("B:C,E:H,K:N").EntireColumn.Hidden = False
End If
If Range("A1").Value = "Report" Then
Range("B:C,E:H,K:N").EntireColumn.Hidden = False
End If
Range("B:C,E:H,K:N").EntireColumn.Hidden = False
End If
End Sub
This will hide Columns, B,C,E,F,G,H,K, AND N.
Adjust this to fit your needs.

Click A1 and choose Data, and everything is unhidden.

Now click A1 again and choose Report and the columns are hidden.

I hope this makes your day a little easier.
Tuesday, October 2, 2012
Engineering Stationing Custom Format
This is going to be a short but useful one for those who need to work with Stations.
To keep values as numbers and display them as Stations we will need to create a custom format.
Select the cells you want to display as stations, rightclick and choose format.
Under the Number Tab choose Custom at the bottom.
Input this"##+#0.00" as the Type:


To keep values as numbers and display them as Stations we will need to create a custom format.
Select the cells you want to display as stations, rightclick and choose format.
Under the Number Tab choose Custom at the bottom.
Input this"##+#0.00" as the Type:

Now our raw number of 8676.70 in N3 is displayed as 86+76.70

Thursday, September 20, 2012
Advance Filters
The best way to set up a sheet to use Advanced filters is to add a few rows above your data.
We will start with this data: Its the Invoice table from the famous Northwind Trading Company. (A Sample database provided by Microsoft)


We will start with this data: Its the Invoice table from the famous Northwind Trading Company. (A Sample database provided by Microsoft)

And add a few rows at the top.

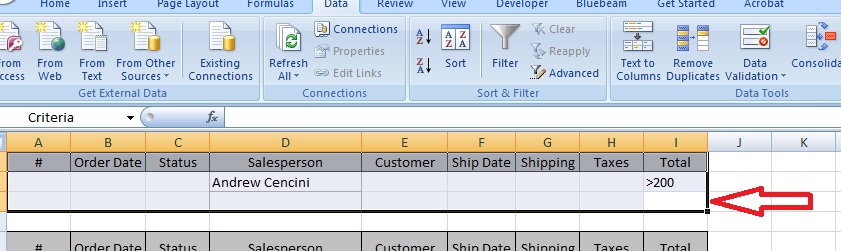
For this example we can add references in row 1 to mirror the tables headers in A4

Now we can add some criteria: For the names I like to just copy and paste data from the tables.
Copy both Andrew and Robert under the Salesperon header of the filter. Under Total I only want ones that are by Andrew AND greater than 100 OR by Robert AND greater than 200.

After adding the criteria we can apply the filter.
In the data tab, click advanced

The Advance filter window will pop up.
The list range, is the data in the table A5:I53
The criteria range is A1:I3 this will include the filter header and all rows below it that contain data.
Note: Be sure all of the rows you select in the filter data range contain data, or excel will include all results with no constraints. (It returns all of your data)
Click OK and now only the data were looking for is shown.

When you are finished reviewing the data or want to try another combination, press the clear button and try again.

Top Tip: When adding criteria 2 constraints in the same row will be calculated as AND, constraints in seperate rows will be calculated as OR. For our example above we are looking for invoices that were completed by Andrew AND were greater than 100, OR, by Robert AND greater than 200.
Friday, September 14, 2012
Calculating Filtered Values - The Subtotal
Excel filters are great, but wouldnt it be powerful to be able the to run calculations on the data as the filters change? The underutilized SUBTOTAL function should be added to your tool belt.
Syntax:
SUBTOTAL(Function,ref1,ref2,..)
There are seperate functions that will include or ignore Hidden values.
Note: Subtotal will automatically ignore any hidden data that is hidden becuase of the use of a filter.
Lets look at an example:
The example below is counting the number of entries currently shown.
We have a list of fruit that we want to count.
In cell B2 the forumula =SUBTOTAL(103,C3:C35) will (CountA, the Range C3:C35), there are 33 records.
Note: CountA returns the number of non blank cells (Used to count cells with text or numbers)
Count returns the number of cells that contain a number. (Used to count cells with numbers only)


Syntax:
SUBTOTAL(Function,ref1,ref2,..)
There are seperate functions that will include or ignore Hidden values.
Note: Subtotal will automatically ignore any hidden data that is hidden becuase of the use of a filter.
Include Hidden Values
|
Function
|
Ignores Hidden Values
|
1
|
AVERAGE
|
101
|
2
|
COUNT
|
102
|
3
|
COUNTA
|
103
|
4
|
MAX
|
104
|
5
|
MIN
|
105
|
6
|
PRODUCT
|
106
|
7
|
STDEV
|
107
|
8
|
STDEVP
|
108
|
9
|
SUM
|
109
|
10
|
VAR
|
110
|
11
|
VARP
|
111
|
Lets look at an example:
The example below is counting the number of entries currently shown.
We have a list of fruit that we want to count.
In cell B2 the forumula =SUBTOTAL(103,C3:C35) will (CountA, the Range C3:C35), there are 33 records.
Note: CountA returns the number of non blank cells (Used to count cells with text or numbers)
Count returns the number of cells that contain a number. (Used to count cells with numbers only)

If we add a filter to only show Apples and Oranges, this list shrinks.

The Subtotal is now 21, the calculation is ignoring the hidden data.

The next time your working with Filteres or hidden data, dont forget to make use of SUBTOTAL.
Thursday, September 13, 2012
Counting Cell Background Colors
I have had several requests over the years for a function to count cells based on their background color.
Here is my solution. 2 Custom Functions.
If you dont know how to add a new function I will cover this in a later blog but for today we will skip that part.
The first function is CellColor and will help you identify the color index of a cell.
Function CellColor(CRange As Range)
Dim cell As Range
For Each cell In CRange
CellColor = cell.Interior.ColorIndex
Next cell
End Function

Now that we know the color of a cell we can use the next function CountColor to count the cells.
Function CountColor(CRange As Range, Color As Integer)
Dim Ccount As Integer
Dim cell As Range
For Each cell In CRange
If cell.Interior.ColorIndex = Color Then
Ccount = Ccount + 1
End If
Next cell
CountColor = Ccount
End Function

In the image above Cell B23 has the forumula =countcolor($A$2:$A$22,38) which returns 10.
Top Tip: Use them together and you don't have to remember that 38 is the index color of red.
=countcolor(A2:A22,CELLcolor(A2)) will return 10 as well.
Here is my solution. 2 Custom Functions.
If you dont know how to add a new function I will cover this in a later blog but for today we will skip that part.
The first function is CellColor and will help you identify the color index of a cell.
Function CellColor(CRange As Range)
Dim cell As Range
For Each cell In CRange
CellColor = cell.Interior.ColorIndex
Next cell
End Function

In the image above Cell B2 has the formula =Cellcolor(A2) which returns 38. Now we know what were looking for.
Now that we know the color of a cell we can use the next function CountColor to count the cells.
Function CountColor(CRange As Range, Color As Integer)
Dim Ccount As Integer
Dim cell As Range
For Each cell In CRange
If cell.Interior.ColorIndex = Color Then
Ccount = Ccount + 1
End If
Next cell
CountColor = Ccount
End Function

In the image above Cell B23 has the forumula =countcolor($A$2:$A$22,38) which returns 10.
Top Tip: Use them together and you don't have to remember that 38 is the index color of red.
=countcolor(A2:A22,CELLcolor(A2)) will return 10 as well.
First Post
Thanks for checking out my Excel blog. My goal here is to share the exciting world of Excel to everyone I can. If your looking for a solution to a problem send me a message and Ill be more than happy to help you out.
Subscribe to:
Posts (Atom)